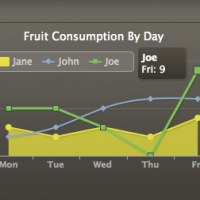
By mupet on December 30, 2009
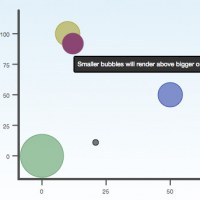
moochart is a plugin for MooTools 1.2 to create goog looking and customable bubble diagrams on the canvas tag. The moochart can be customized using a bunch of options or argument such as, width, height, bubbleSize, line color , bubble color, tooltips and more.
Posted in Charts/Graph, Mootools | Tagged chart, Mootools
By mupet on December 24, 2009
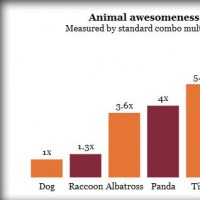
TufteGraph is a jQuery plugin that allow us to create standard & bar charts. It is different from other javascript charting libraries because, TufteGraph is configurable and it has dynamic functions, allowing for a really compact API (very few options and non-core layout is done via CSS rather than code.
Posted in Charts/Graph, JQuery | Tagged chart, graph, JQuery
By mupet on December 20, 2009
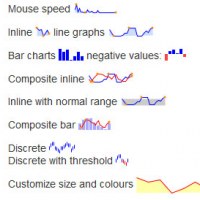
sparkline is jQuery plugin to generates sparklines (small inline charts) directly in the browser using data supplied either inline in the HTML, or via javascript. This JQuery plugin allow Us to easily create line (default), bar, tristate, discrete, bullet, pie or box charts.
Posted in Charts/Graph, JQuery | Tagged chart, jQuery plugin
By mupet on December 16, 2009
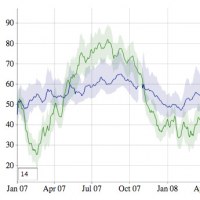
Dygraphs is an open source JavaScript library that produces produces interactive, zoomable charts of time series. It is designed to display dense data sets and enable users to explore and interpret them. You can mouse over to highlight individual values. Click and drag to zoom. Double-click to zoom back out.
Posted in Charts/Graph, Javascript | Tagged chart, Charts/Graph, graph
By mupet on December 3, 2009
Highcharts is a charting library written in pure JavaScript, offering an easy way of adding interactive charts to your web site or web application. Highcharts currently supports line, spline, area, areaspline, column, bar, pie and scatter chart types.
Posted in Charts/Graph | Tagged chart, Charts/Graph
By mupet on October 12, 2009
TableToChart is a MooTools script that can take a HTML table source and automatically draw a graphic chart based on the table data.
Posted in Charts/Graph, Mootools | Tagged chart, Mootool
By mupet on October 9, 2009
Filamentgroup wrote a great article describing a technique how to use JavaScript to scrape data from an HTML table and generate charts using the HTML 5 Canvas element.
Posted in Charts/Graph, JQuery | Tagged canvas, chart, HTML5


Recent comments