By mupet on December 16, 2009
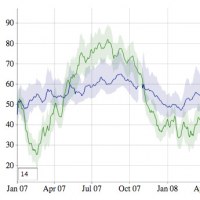
Dygraphs is an open source JavaScript library that produces produces interactive, zoomable charts of time series. It is designed to display dense data sets and enable users to explore and interpret them. You can mouse over to highlight individual values. Click and drag to zoom. Double-click to zoom back out.
Posted in Charts/Graph, Javascript | Tagged chart, Charts/Graph, graph
By mupet on December 3, 2009
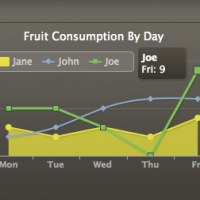
Highcharts is a charting library written in pure JavaScript, offering an easy way of adding interactive charts to your web site or web application. Highcharts currently supports line, spline, area, areaspline, column, bar, pie and scatter chart types.
Posted in Charts/Graph | Tagged chart, Charts/Graph


Recent comments